Monitoring
The Monitoring section provides a comprehensive overview of the current status and resource utilization of the virtual device. It displays key performance metrics such as CPU usage, RAM consumption, disk activity, and network traffic, enabling users to quickly assess the health and performance of the virtual environment in real-time.
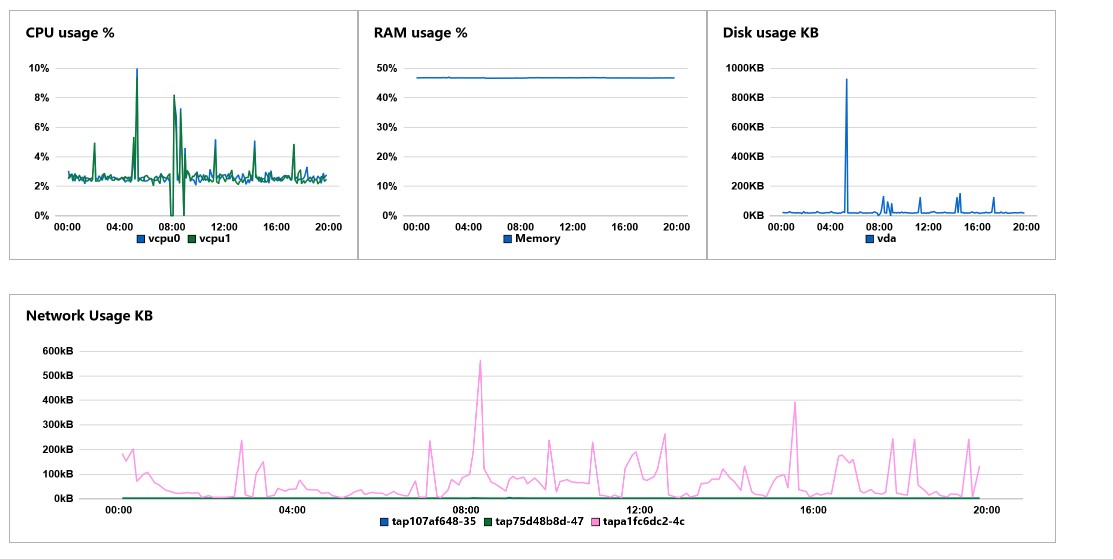
Overview of Monitoring graphs
CPU usage
This graph illustrates the CPU utilization of the virtual machine over a given period, providing insights into how the VM's processing resources are being consumed. It specifically tracks the percentage of CPU cores actively in use.
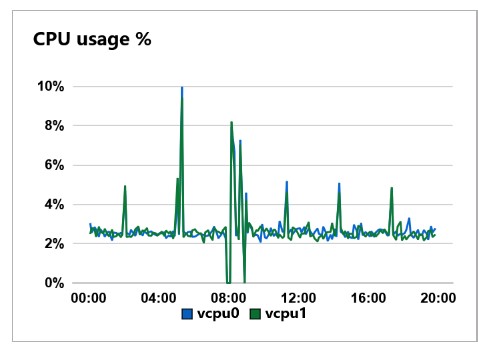
The x-axis represents the progression over time.
The y-axis displays the percentage of CPU usage.
RAM usage
This graph displays the percentage of RAM (memory) utilization over a specific period.It indicates how much of the total allocated memory is being used by the virtual machine.
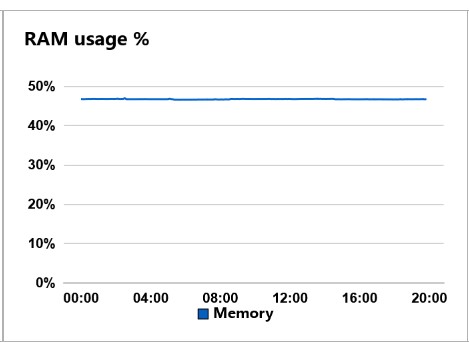
The x-axis represents RAM usage over time.
The y-axis illustrate the memory consumption relative to the total available RAM.
Disk usage
This graph illustrates the disk activity in kilobytes (KB) for the virtual machine running on the infrastructure over a specified period. It captures the amount of data read from or written to the disk, providing insights into the disk Input/Output performance and activity levels of the VNF while it is running.
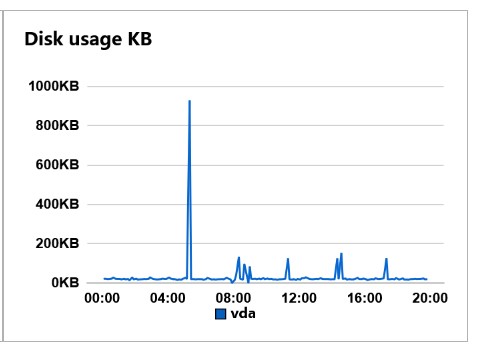
The x-axis shows the progression over time.
The y-axis represents the disk activity in kilobytes.
Network usage
This graph displays the network activity in kilobytes (KB) over a specific period, illustrating the data transfer rates for distinct network connections.
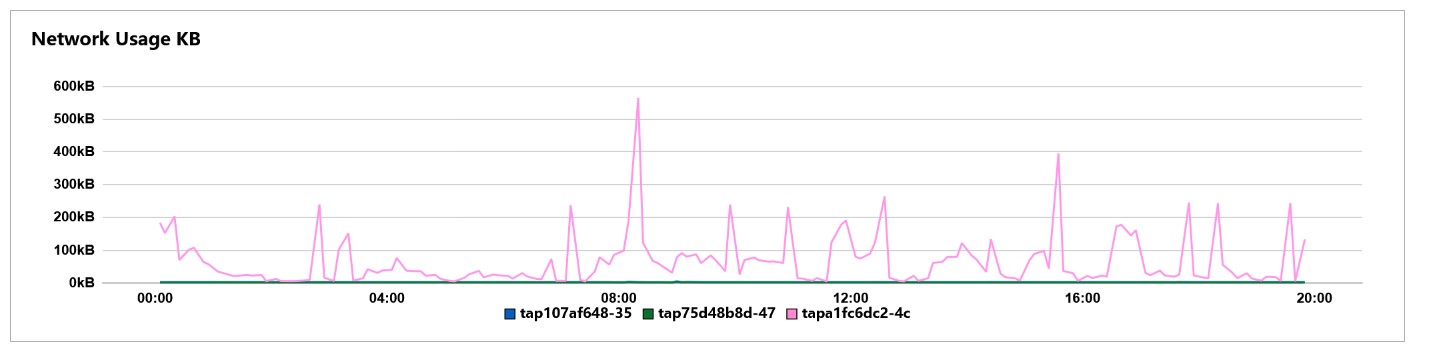
The x-axis shows the progression over time.
The y-axis represents the network usage in kilobytes.