How can the Evolution Platform reduce the environmental impact of services for our clients?
Foundations of Evolution Platform
Evolution Platform is based on a "platform" model of services, very different from the previous "integrated" model. The technical base of Evolution Platform uses a set of SuperPOPs from Orange Business. These are Software Defined Networks (SDN) points of presence deployed worldwide and connected to each other by a private and efficient backbone.
These SuperPOPs will host the virtualized services, previously provided by physical boxes on Clients' sites or using resources in their private Data Centers. These physical boxes being often proprietary solutions related to suppliers and single service.
Centralized and digitalized architecture to reduce environmental impact
This new centralized and digitalized architecture allows to rationalize the infrastructure by sharing it among multiple Clients and optimizing its use. It frees the Client from managing service versioning and optimizes network routing by being closer to the sites of companies and remote workers. Depending on the type of service requested, using Evolution Platform may reduce or eliminate the physical boxes of the Client, and thus may reduce their electricity consumption.
Orange Business is working on decarbonizing SuperPOPs, for example by studying the solarization of its sites, and on energy efficiency to reduce Power Usage Effectiveness (PUE). PUE measures data center energy efficiency, aiming to approach 1 as closely as possible. Water impact is also monitored via the Water Usage Effectiveness (WUE) indicator.
SuperPOPs use Dell servers, certified with the Electronic Product Environmental Assessment Tool (EPEAT) label, which evaluates the environmental impact of electronic products, and ENERGY STAR certified for energy efficiency. Reusing components and recycling raw materials in new Dell server generations has reduced the carbon footprint by over 50% between the 14G and 16G versions.
Orange Business is also engaged in a program of mutualization and convergence of its networks, to rationalize its assets and reduce the environmental impact.
New on-demand platform model open to Partners
Aligned with the economics of functionality, Evolution Platform is a new platform model that delivers connectivity, cloud and cybersecurity solutions on demand. It allows users to consume network services similarly to cloud services, with all associated benefits.
The platform relies on Partners who deploy and update their software via Application Programming Interfaces (APIs). This ensures optimized provisioning and reduces operational intervention. The "service on demand" model, rather than fixed subscriptions, allows service usage to be adapted over time, e.g., increasing or decreasing bandwidth. Clients can compose their services from the "Partner store" library or use predefined, tailored "blueprints." Most partners offer their own management console called Element Management System (EMS): direct, secure links are provided instead of redeveloping EMS functions within Evolution Platform.
All functionalities available on Evolution Platform Console are accessible via API, enabling integration with the Client's Information System and reducing development effort.
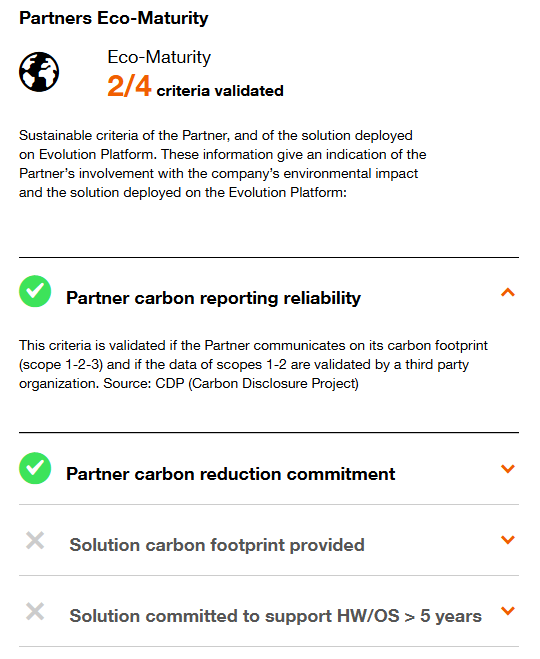
An "Eco maturity" indicator for Partners has been defined, providing general information on their carbon reduction ambitions and specific details about solutions used within Evolution Platform. Below is an example display of a Partner's Eco-maturity:
Measurement and optimisation of carbon footprint
Orange Business is working on measuring the carbon footprint of SuperPOPs and Client services. This will help Clients comply with legislation on carbon footprint reporting and inform them about CO2 emissions resulting from their service configurations. The goal is to reduce environmental impact by monitoring evolution through GreenOps recommendations, similar to FinOps for financial gains.
When a Client orders a service and selects the SuperPOP(s) through which the service will pass, an "eco-rating" is associated with each SuperPOP to make the carbon impact criterion visible. Factors influencing eco-rating include fill rate and location of the SuperPOP. In fact, the energy mix of the country can be more or less carbon-intensive. As of 2024, France's energy mix emits 63.8 gCO2/kWh, while South Africa's is 987.1 gCO2/kWh. Below is an example of SuperPOP eco-rating in a client journey:
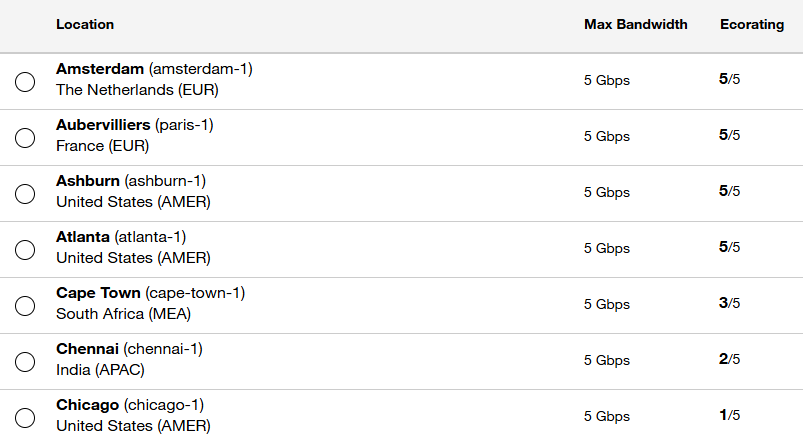
In this example, Chicago's SuperPOP has the worst eco-rating. Eco-rating information will also be visible in the service availability matrix.
Similarly, during service subscription, estimated carbon footprint information will be displayed alongside the financial cost. Below are two examples:
- Subscription to a VNE service with Fortinet firewall in a 4vCPU configuration on Zurich SuperPOP with 50Mbps bandwidth:
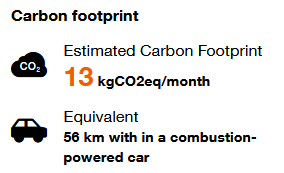
- Subscription to a public Cloud Connect service on Azure in high availability, from Amsterdam and Dublin SuperPOPs with 100Mbps bandwidth: 14kgCO2eq/month, equivalent to 59km driven by a combustion engine car.
Estimated carbon footprint information of the service will also be visible on the price simulator. The methodology used is based on « Methodological standard for the environmental assessment of Datacenter IT hosting services and cloud services » from French agency for the ecological transition (ADEME) (see ADEME methodology), the ITU standards L.1410, ISO 14044, ISO 14067 and the "ICT Sector guidance" of the GHG Protocol.
In addition to financial management, an 'eco dashboard', a dashboard presenting the carbon footprint of all its services, will allow the Client to have extra-financial management through the observability of these resources, enriched by AI and Machine Learning, and through exportable reports.
Illustration through use cases
I am a CEO of a company with over 250 employees based in France. As part of the Corporate Sustainability Reporting Directive (CSRD), I need to provide my company's carbon report. How can I determine the carbon footprint of the services subscribed to on Evolution Platform?
- Answer: The estimated carbon footprint of services is provided either via the price simulator or at the end of the subscription process. Once services are deployed, a dashboard will give the actual monthly carbon footprint. The calculation methodology is provided by Orange, and results can be used for a carbon report. They are mostly based on physical calculations rather than monetary ones for accuracy.
I am the director of a small company, and I am looking to secure access to clouds while
reducing my carbon footprint. What tools are available on Evolution Platform?
- Answer: When subscribing to the service of Cloud Public Connectivity, it is possible to choose a SuperPOP based on its carbon footprint thanks to eco-rating information. To secure exchanges towards this cloud, a VNE service with a Firewall can be subscribed. Among the proposed Partners, the Client can take note of the eco-maturity indicator and select the one with a good level, ensuring that this Partner is committed to reducing its carbon footprint.